X-Y Plot Region - Extends SMath Studio with a X-Y Plot Region. - Messages
#621 Posted: 1/3/2025 6:34:58 AM
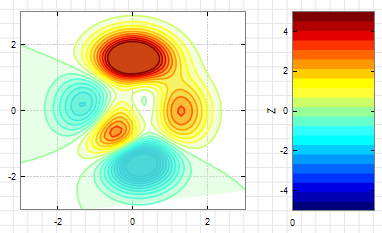
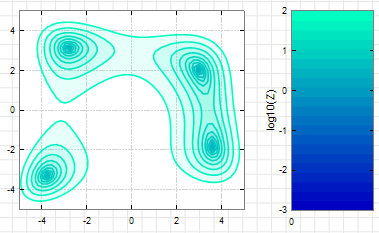
Colored Level curves of implicit functions.
XYContour.sm (75.56 KiB) downloaded 1101 time(s).
XYContour.pdf (298.27 KiB) downloaded 601 time(s).
Best regards.
Alvaro.


XYContour.sm (75.56 KiB) downloaded 1101 time(s).
XYContour.pdf (298.27 KiB) downloaded 601 time(s).
Best regards.
Alvaro.
3 users liked this post
Вячеслав Мезенцев 1/3/2025 9:35:00 AM, francesco rapuano 1/3/2025 3:58:00 PM, sergio 1/3/2025 3:23:00 PM
#622 Posted: 5/22/2025 9:31:23 PM
The XY plot plugin works mostly fine for me, but I have a little suggestion that would probably not be too hard to fix:
Just skip plotting imaginary numbers in the graph. Let the user make them real if he wants to see them. That is the easiest way of handling complex input values, I believe.
Just skip plotting imaginary numbers in the graph. Let the user make them real if he wants to see them. That is the easiest way of handling complex input values, I believe.
#623 Posted: 5/23/2025 8:02:07 AM
Wrote... Just skip plotting imaginary numbers in the graph. Let the user make them real if he wants to see them. That is the easiest way of handling complex input values, I believe.
It's not quite clear what you mean. The user needs to be informed that complex numbers are not displayed simultaneously with real numbers.

Edited 5/23/2025 8:05:35 AM
Russia ☭ forever, Viacheslav N. Mezentsev
1 users liked this post
Davide Carpi 5/23/2025 8:25:16 AM
#624 Posted: 5/23/2025 10:23:33 AM
The error message could be extended by "Use Re(), Im(), abs() or arg() to plot real or imaginary part or radius or angle respectively."
It might be an interesting feature to plot a series of complex numbers as a polygon, just like a two-column matrix. Such that plotting p would give the same result as plotting P in the following example:

It might be an interesting feature to plot a series of complex numbers as a polygon, just like a two-column matrix. Such that plotting p would give the same result as plotting P in the following example:

Martin KraskaPre-configured portable distribution of SMath Studio: https://en.smath.info/wiki/SMath%20with%20Plugins.ashx
#625 Posted: 5/24/2025 10:02:21 PM
Hello!
I have seen before on this forum that there was an option to configure a "Properties Source" tab in the XY plot format window. Sadly I cannot find it in my instance of SMath. I would like to set the limits of my plots to be changed by variables declared in my sheet and if I understood it correctly this option should be in the Properties Source tab. Is this feature still available in XYPlot?
Thanks in advance
Adam

Edited 5/24/2025 10:08:14 PM
#626 Posted: 5/25/2025 6:21:08 AM
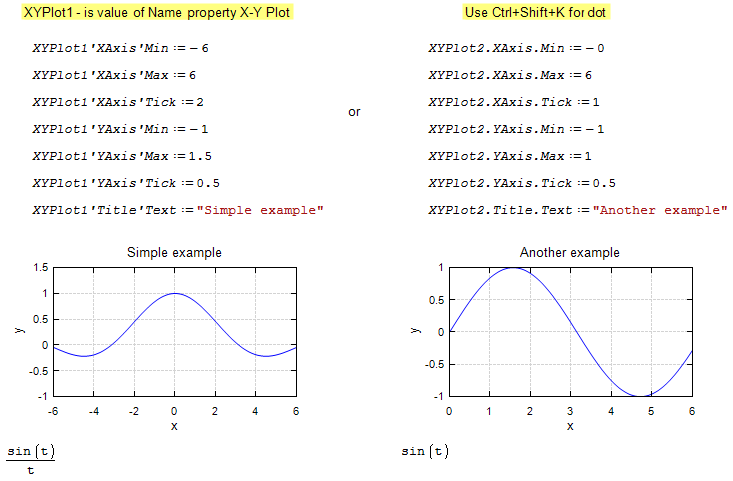
The oldest method of changing component properties has been removed (link).
Now you can set the component properties "directly": link
xyplot-set-properties-min-example.sm (10.36 KiB) downloaded 1119 time(s).
To avoid editing documents, you can try this method. But you need to set a value for the Name property of the component.
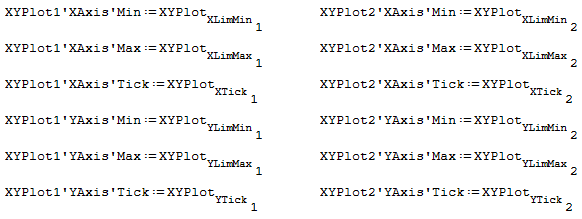
xyplot-set-properties-support-old-style.sm (6.26 KiB) downloaded 1062 time(s).
Now you can set the component properties "directly": link

xyplot-set-properties-min-example.sm (10.36 KiB) downloaded 1119 time(s).
To avoid editing documents, you can try this method. But you need to set a value for the Name property of the component.

xyplot-set-properties-support-old-style.sm (6.26 KiB) downloaded 1062 time(s).
Edited 5/25/2025 6:27:03 AM
Russia ☭ forever, Viacheslav N. Mezentsev
4 users liked this post
Nagy Varga Ádám 5/25/2025 11:54:06 AM, NDTM Amarasekera 5/25/2025 1:12:46 PM, Alvaro 5/25/2025 7:43:17 PM, federico 5/26/2025 6:14:34 AM
#628 Posted: 7/22/2025 5:44:00 AM
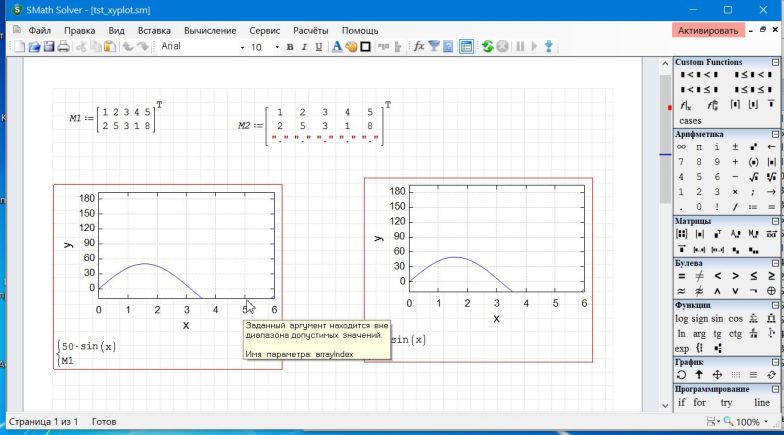
I just started to use SMath. I have problems with X-Y Plot. I want to plot a table (a set of values), or several tables, but the program gives error "The argument provided is out of the interval of the allowed values. Name of the parameter: array/index" (translated to English). I can do such a plot in old versions of SMath, but not in the current one. I have SMath ver. 1.3.0.9126, extension X-Y Plot Region ver. 0.3.9106.25707. I also tried some examples from this thread, some of them also do not work, see attached '2D Plot - Axis Control_r1.sm'
tst_xyplot.sm (8.01 KiB) downloaded 690 time(s).
2D Plot - Axis Control_r1.sm (14.61 KiB) downloaded 740 time(s).
tst_xyplot.sm (8.01 KiB) downloaded 690 time(s).
2D Plot - Axis Control_r1.sm (14.61 KiB) downloaded 740 time(s).
#629 Posted: 7/22/2025 6:44:00 AM
Try updating the plugin.
I don't recommend using the setprop() function because it affects other open documents. Use the method I showed.


2D Plot - Axis Control_r1.sm (16.63 KiB) downloaded 685 time(s).
I don't recommend using the setprop() function because it affects other open documents. Use the method I showed.


2D Plot - Axis Control_r1.sm (16.63 KiB) downloaded 685 time(s).
Edited 7/25/2025 6:52:39 AM
Russia ☭ forever, Viacheslav N. Mezentsev
#630 Posted: 7/22/2025 7:14:28 AM
In the picture above I showed a new version that has not been released yet, but the component should still work.
Russia ☭ forever, Viacheslav N. Mezentsev
#631 Posted: 7/22/2025 7:38:59 AM
Thank you for a quick reply. Where can I find a new version of the plugin? The SMath program suggests only ver. 0.3.9106.25707. Also in these links:
https://smath.info/en-US/licensing/api/Extensions?type=Plugin
https://smath.com/en-US/licensing/api/Extensions?type=Plugin
only that version is listed.
https://smath.info/en-US/licensing/api/Extensions?type=Plugin
https://smath.com/en-US/licensing/api/Extensions?type=Plugin
only that version is listed.
#632 Posted: 7/22/2025 9:05:50 AM
The new version is not yet available, as it is not posted to the general repository. The changes concern work with a large resolution, so that the appearance of the output text looks the same for different resolutions.
Your examples should work with the current version of the plugin. I checked that too.
Your examples should work with the current version of the plugin. I checked that too.
Russia ☭ forever, Viacheslav N. Mezentsev
#633 Posted: 7/22/2025 11:32:39 AM
#634 Posted: 7/22/2025 1:46:32 PM
I can't reproduce this behavior. Try another function as an argument or change the number of points. It is not clear what causes the error.
Russia ☭ forever, Viacheslav N. Mezentsev
#635 Posted: 7/23/2025 7:46:30 AM
WroteI can't reproduce this behavior. Try another function as an argument or change the number of points. It is not clear what causes the error.
Probably, something is wrong with my installation. I re-installed SMath and plugins. Maybe, some other plugins are necessary. But the error still exists. I modified the code (attached), added another vectors, but no success. X-Y Plot plots function, but does not plot tables.
Thank you for your help.
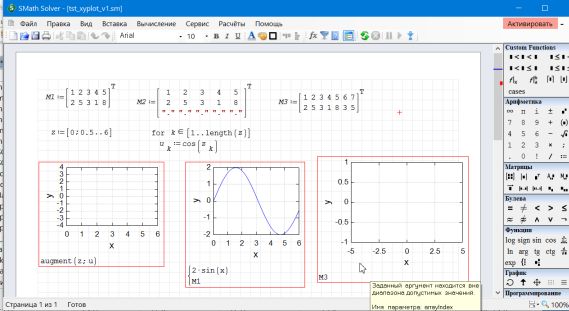
tst_xyplot_v1.sm (11.4 KiB) downloaded 681 time(s).
#636 Posted: 7/23/2025 8:23:09 AM
Okay, but can you try other graphs with the same arguments (2D plot, ZedGraph, NPlot)?
Russia ☭ forever, Viacheslav N. Mezentsev
#637 Posted: 7/23/2025 8:58:34 AM
I can see plots in 2D Plot and NPlot, but not in XY-Plot and ZedGraph, see attachments. ZedGraph gives the same error "Name of parameter: array/index".
tst_xyplot_v2.sm (115.14 KiB) downloaded 672 time(s).
tst_xyplot_v2.pdf (396.71 KiB) downloaded 205 time(s).
tst_xyplot_v2.sm (115.14 KiB) downloaded 672 time(s).
tst_xyplot_v2.pdf (396.71 KiB) downloaded 205 time(s).
#638 Posted: 7/23/2025 9:47:20 AM
The problem may be related to the installed .Net frameworks. The error text is not contained in the component, it occurs internally but is not caught by it. Therefore, it is difficult to localize the cause of the error. Andrey could do this, but I doubt that he will be able to repeat such behavior.


Russia ☭ forever, Viacheslav N. Mezentsev
1 users liked this post
Ed 7/23/2025 11:07:12 AM
#639 Posted: 7/23/2025 11:09:47 AM
Thank you, Viacheslav. I will try to install .Net and see what will happen.
#640 Posted: 7/23/2025 11:45:10 AM
- New Posts
- No New Posts


