X-Y Plot Region - Extends SMath Studio with a X-Y Plot Region. - Сообщения
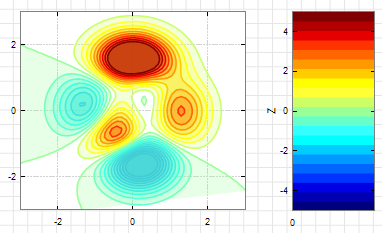
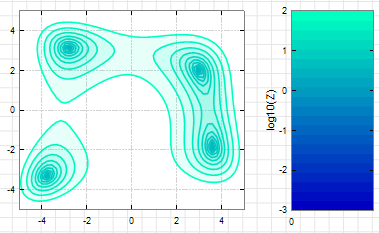
Colored Level curves of implicit functions.
XYContour.sm (75,56 КиБ) скачан 1417 раз(а).
XYContour.pdf (298,27 КиБ) скачан 762 раз(а).
Best regards.
Alvaro.
XYContour.sm (75,56 КиБ) скачан 1417 раз(а).
XYContour.pdf (298,27 КиБ) скачан 762 раз(а).
Best regards.
Alvaro.
3 пользователям понравился этот пост
Вячеслав Мезенцев 03.01.2025 09:35:00, sergio 03.01.2025 15:23:00, francesco rapuano 03.01.2025 15:58:00
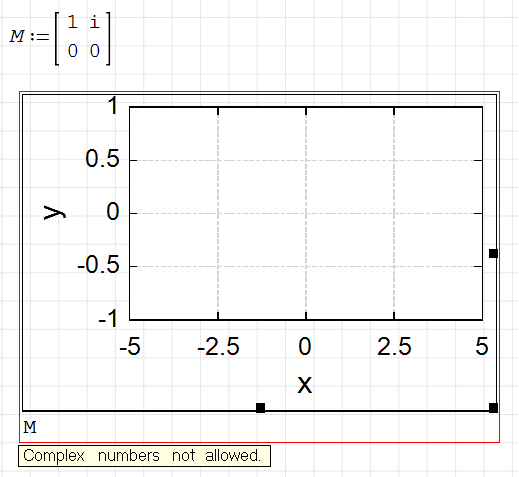
The XY plot plugin works mostly fine for me, but I have a little suggestion that would probably not be too hard to fix:
Just skip plotting imaginary numbers in the graph. Let the user make them real if he wants to see them. That is the easiest way of handling complex input values, I believe.
Just skip plotting imaginary numbers in the graph. Let the user make them real if he wants to see them. That is the easiest way of handling complex input values, I believe.

Wrote... Just skip plotting imaginary numbers in the graph. Let the user make them real if he wants to see them. That is the easiest way of handling complex input values, I believe.
It's not quite clear what you mean. The user needs to be informed that complex numbers are not displayed simultaneously with real numbers.
Отредактировано 23.05.2025 08:05:35
Russia ☭ forever, Viacheslav N. Mezentsev
1 пользователям понравился этот пост
Davide Carpi 23.05.2025 08:25:16
The error message could be extended by "Use Re(), Im(), abs() or arg() to plot real or imaginary part or radius or angle respectively."
It might be an interesting feature to plot a series of complex numbers as a polygon, just like a two-column matrix. Such that plotting p would give the same result as plotting P in the following example:
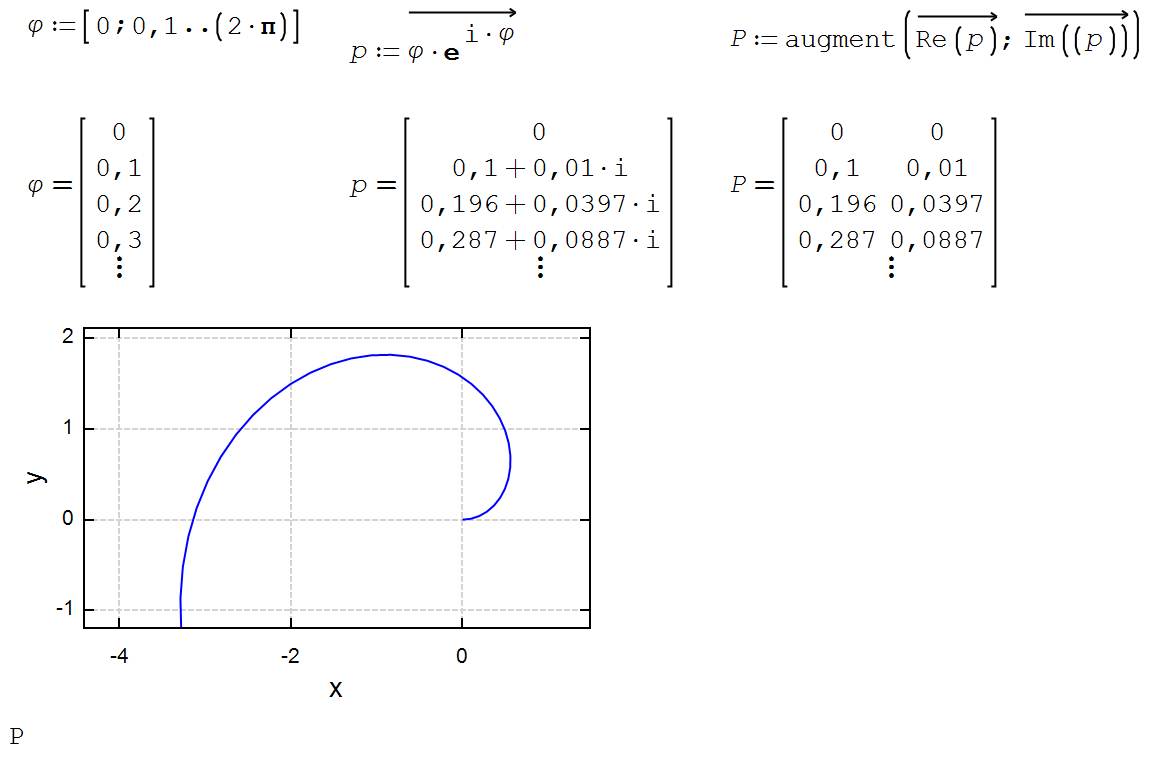
It might be an interesting feature to plot a series of complex numbers as a polygon, just like a two-column matrix. Such that plotting p would give the same result as plotting P in the following example:
Technische Mechanik mit SMath Studio: https://link.springer.com/book/10.1007/978-3-658-50592-9
Hello!
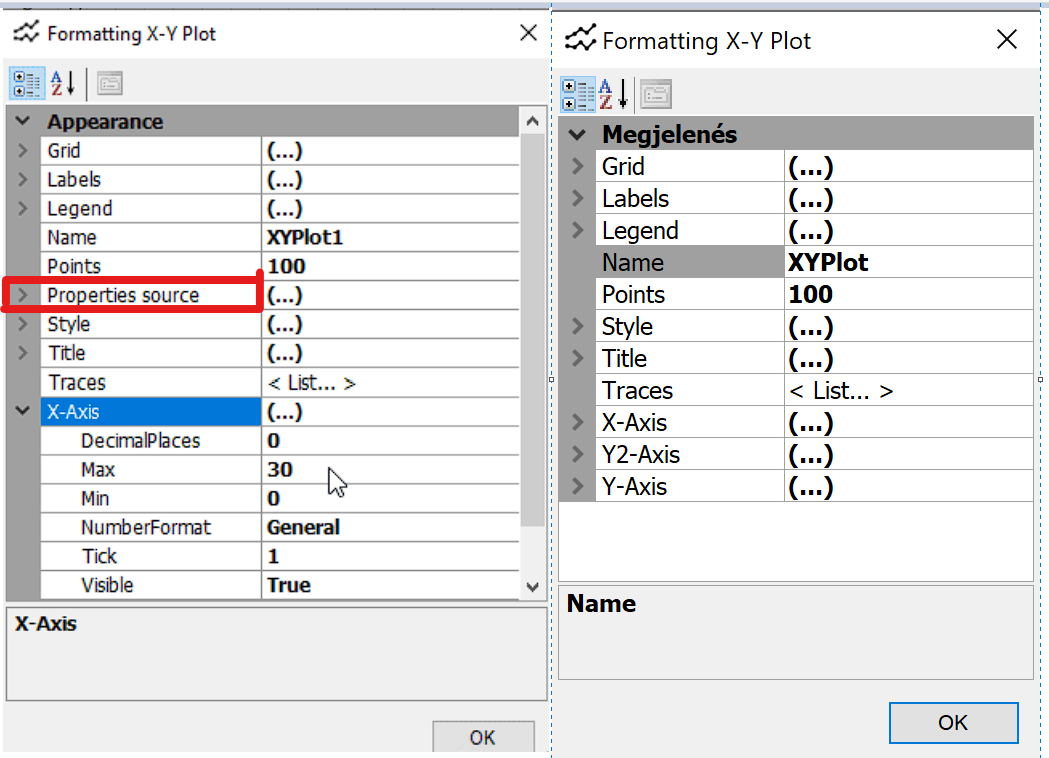
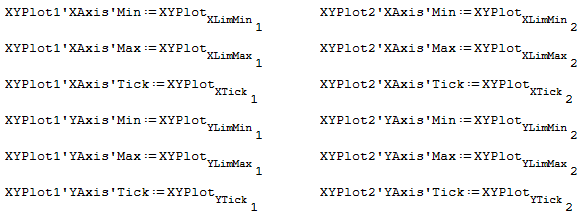
I have seen before on this forum that there was an option to configure a "Properties Source" tab in the XY plot format window. Sadly I cannot find it in my instance of SMath. I would like to set the limits of my plots to be changed by variables declared in my sheet and if I understood it correctly this option should be in the Properties Source tab. Is this feature still available in XYPlot?
Thanks in advance
Adam
Отредактировано 24.05.2025 22:08:14
The oldest method of changing component properties has been removed (link).
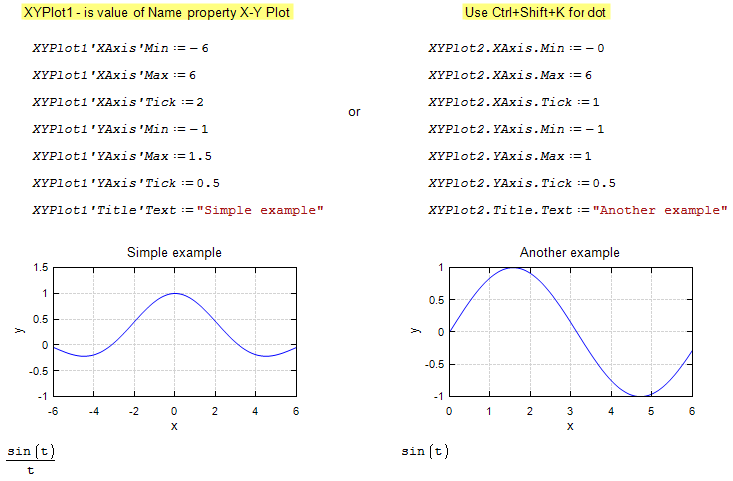
Now you can set the component properties "directly": link
xyplot-set-properties-min-example.sm (10,36 КиБ) скачан 1435 раз(а).
To avoid editing documents, you can try this method. But you need to set a value for the Name property of the component.
xyplot-set-properties-support-old-style.sm (6,26 КиБ) скачан 1390 раз(а).
Отредактировано 25.05.2025 06:27:03
Russia ☭ forever, Viacheslav N. Mezentsev
4 пользователям понравился этот пост
federico 26.05.2025 06:14:34, Alvaro 25.05.2025 19:43:17, NDTM Amarasekera 25.05.2025 13:12:46, Nagy Varga Ádám 25.05.2025 11:54:06

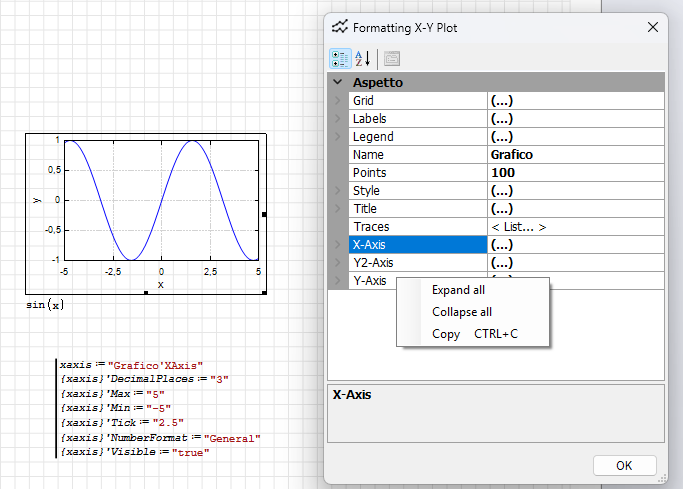
I never remember the correct syntax, but it's worth to say that it can be obtained also from the properties of (say) X-Axis, with "copy" command (to be pasted back in smath file).
1 пользователям понравился этот пост
Davide Carpi 26.05.2025 10:25:54
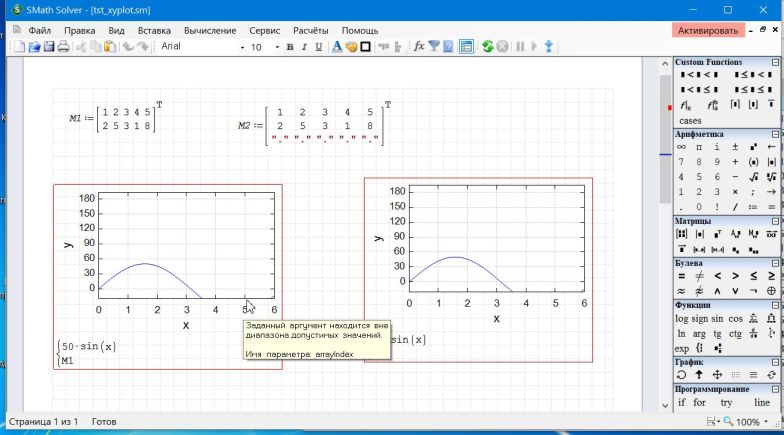
I just started to use SMath. I have problems with X-Y Plot. I want to plot a table (a set of values), or several tables, but the program gives error "The argument provided is out of the interval of the allowed values. Name of the parameter: array/index" (translated to English). I can do such a plot in old versions of SMath, but not in the current one. I have SMath ver. 1.3.0.9126, extension X-Y Plot Region ver. 0.3.9106.25707. I also tried some examples from this thread, some of them also do not work, see attached '2D Plot - Axis Control_r1.sm'
tst_xyplot.sm (8,01 КиБ) скачан 973 раз(а).
2D Plot - Axis Control_r1.sm (14,61 КиБ) скачан 1008 раз(а).
tst_xyplot.sm (8,01 КиБ) скачан 973 раз(а).
2D Plot - Axis Control_r1.sm (14,61 КиБ) скачан 1008 раз(а).
Try updating the plugin.
I don't recommend using the setprop() function because it affects other open documents. Use the method I showed.


2D Plot - Axis Control_r1.sm (16,63 КиБ) скачан 964 раз(а).
I don't recommend using the setprop() function because it affects other open documents. Use the method I showed.
2D Plot - Axis Control_r1.sm (16,63 КиБ) скачан 964 раз(а).
Отредактировано 25.07.2025 06:52:39
Russia ☭ forever, Viacheslav N. Mezentsev
In the picture above I showed a new version that has not been released yet, but the component should still work.
Russia ☭ forever, Viacheslav N. Mezentsev
Thank you for a quick reply. Where can I find a new version of the plugin? The SMath program suggests only ver. 0.3.9106.25707. Also in these links:
https://smath.info/en-US/licensing/api/Extensions?type=Plugin
https://smath.com/en-US/licensing/api/Extensions?type=Plugin
only that version is listed.
https://smath.info/en-US/licensing/api/Extensions?type=Plugin
https://smath.com/en-US/licensing/api/Extensions?type=Plugin
only that version is listed.
The new version is not yet available, as it is not posted to the general repository. The changes concern work with a large resolution, so that the appearance of the output text looks the same for different resolutions.
Your examples should work with the current version of the plugin. I checked that too.
Your examples should work with the current version of the plugin. I checked that too.
Russia ☭ forever, Viacheslav N. Mezentsev
Sorry, the current version of SMath with X-Y Plot ver. 0.3.9106.25707 does not work, in program tst_xyplot.sm plots are not generated.
Please see a copy of my screen below. Anyway, it is not very crucial for me. I will wait for a new version of the plugin. Thank you.
Please see a copy of my screen below. Anyway, it is not very crucial for me. I will wait for a new version of the plugin. Thank you.
Отредактировано 22.07.2025 11:35:50
I can't reproduce this behavior. Try another function as an argument or change the number of points. It is not clear what causes the error.
Russia ☭ forever, Viacheslav N. Mezentsev
WroteI can't reproduce this behavior. Try another function as an argument or change the number of points. It is not clear what causes the error.
Probably, something is wrong with my installation. I re-installed SMath and plugins. Maybe, some other plugins are necessary. But the error still exists. I modified the code (attached), added another vectors, but no success. X-Y Plot plots function, but does not plot tables.
Thank you for your help.
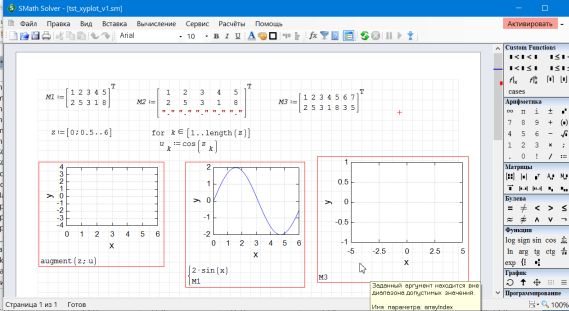
tst_xyplot_v1.sm (11,4 КиБ) скачан 959 раз(а).
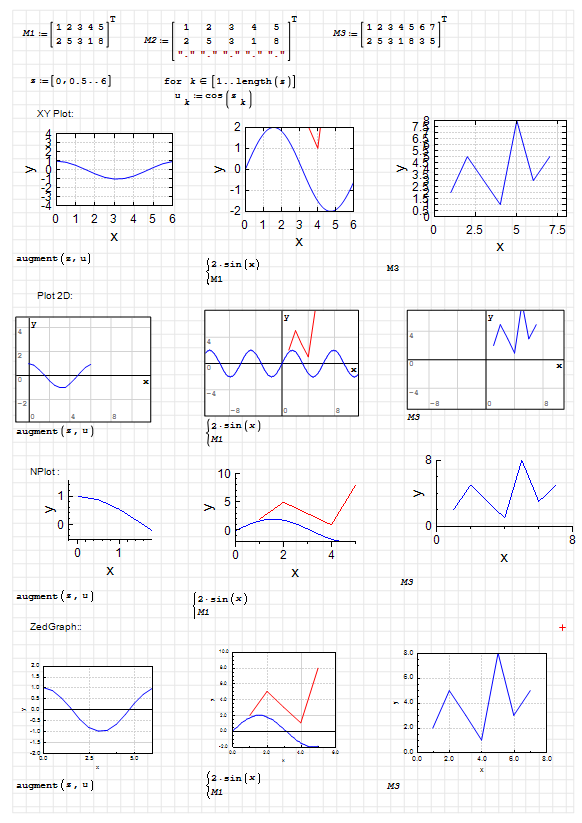
Okay, but can you try other graphs with the same arguments (2D plot, ZedGraph, NPlot)?
Russia ☭ forever, Viacheslav N. Mezentsev
I can see plots in 2D Plot and NPlot, but not in XY-Plot and ZedGraph, see attachments. ZedGraph gives the same error "Name of parameter: array/index".
tst_xyplot_v2.sm (115,14 КиБ) скачан 981 раз(а).
tst_xyplot_v2.pdf (396,71 КиБ) скачан 321 раз(а).
tst_xyplot_v2.sm (115,14 КиБ) скачан 981 раз(а).
tst_xyplot_v2.pdf (396,71 КиБ) скачан 321 раз(а).
The problem may be related to the installed .Net frameworks. The error text is not contained in the component, it occurs internally but is not caught by it. Therefore, it is difficult to localize the cause of the error. Andrey could do this, but I doubt that he will be able to repeat such behavior.
Russia ☭ forever, Viacheslav N. Mezentsev
1 пользователям понравился этот пост
Ed 23.07.2025 11:07:12
Thank you, Viacheslav. I will try to install .Net and see what will happen.
Try to install Development Tools.


Отредактировано 25.07.2025 06:50:44
Russia ☭ forever, Viacheslav N. Mezentsev
- Новые сообщения
- Нет новых сообщений